Starting
A common challenge when approaching a new vulnerability research problem is getting started. This is especially true when there is little prior research and strict time constraints. I was very interested when Parallels Desktop was announced as a new target for the Zero Day Initiative’s Pwn2Own Vancouver 2021 in the virtualization category. It was intriguing to me as there had been little prior research on it. I suspected there would be a wide range of issues in Parallels, so many different approaches would likely succeed. However, the demands for my time and energy, at the time, were particularly onerous. Our second son was due to be born any day! I would need to be focused and purposeful.
This blog post will detail the approach I took to find and successfully exploit a vulnerability in Parallels Desktop for Pwn2Own Vancouver 2021. The vulnerability and exploit are not particularly interesting. There is nothing novel there. Instead, I will focus on the process I took, and the decisions I made.
In order to be successful, I would need to pivot from running code inside a guest virtual machine to executing code on the host machine by exploiting an unknown vulnerability in the hypervisor code. This involved several steps along the way, but step one was just getting started. I would then need to find an exploitable vulnerability and understand the system well enough to exploit it to get code running on the host. For Pwn2Own the host would need to be a fully updated Mac OSX running Big Sur. This would later prove to be problematic as initially I only had an old iMac that was incapable of running Big Sur.
Night 1: Installation and background research
I first installed the latest version of Parallels Desktop and built a Ubuntu virtual machine (VM). I discovered that logs for the VM could be found in the parallels.log file on the host. This was very helpful! I then started looking at some of the provided utility programs and learned that I could turn on verbose logging with the prlsrvctl program.
After examining the log, I learned a few things. The system was loading hypervisor code (obviously) from somewhere. At this point I didn’t know where this code was located on disk. Parallels also has a host user mode component called prl_vm_app. Earlier research by Reno Robert had found a vulnerability in prl_vm_app by fuzzing the VGA device’s port I/O addresses. Previous Pwn2Own exploits in other hypervisors (VMware Workstation and VirtualBox) had also targeted virtual hardware components. This seemed like a good place and way to start.
Night 2: A simple fuzzer and a hypervisor
I only had a couple of hours on night two, so I wrote the simplest port I/O fuzzer I could. This first fuzzer simply wrote random data to random I/O port addresses in the guest. Remarkably, the hypervisor crashed after fuzzing only a couple virtual hardware devices (identified by reading the /proc/ioports file and running the lspci command)! These particular crashes were not in the prl_vm_app user mode process. Rather they were in the highly privileged hypervisor code! Parallels helpfully produced a crash report complete with detailed logs and data dumps. It was obvious from the logs that the cause of the crash was an ASSERT in the hypervisor. This crash is not likely to be very useful for Pwn2Own because the asserts are tests for erroneous conditions that cause execution to halt before memory corruption or other exploitable conditions occur. However, the logs provided a backtrace (with function names!) and register contents where the ASSERT happened:
| 01-27 15:03:52.943 F /MonitorBacktraces:6739:358e1/ mon.stack: <fffff00000197740> AbortRaw+0xf0 01-27 15:03:52.943 F /MonitorBacktraces:6739:358e1/ mon.stack: <fffff000000d305f> CmosOutPortFunc+0x81f 01-27 15:03:52.943 F /MonitorBacktraces:6739:358e1/ mon.stack: <fffff000000fb292> IoWriteHandleStatus+0xe2 01-27 15:03:52.943 F /MonitorBacktraces:6739:358e1/ mon.stack: <fffff000000fb2f4> IoWriteHandleStatus+0x144 01-27 15:03:52.943 F /MonitorBacktraces:6739:358e1/ mon.stack: <fffff000000fb2cf> IoWriteHandleStatus+0x11f 01-27 15:03:52.943 F /MonitorBacktraces:6739:358e1/ mon.stack: <fffff000000804b9> VtxLoopIteration+0x7909 01-27 15:03:52.943 F /MonitorBacktraces:6739:358e1/ mon.stack: <fffff0000005d1e9> _MonAppCmdHandlerDispatch+0x62c9 01-27 15:03:52.943 F /MonitorBacktraces:6739:358e1/ mon.stack: <fffff00000002268> _MonAppCmdHandler+0xd |
Even better, Parallels provided a memory dump of the hypervisor code in the form of a Mach-O binary! This was very helpful for the reverse engineering ahead. Not a bad start!
Night 3: Another simple fuzzer
On this night I wrote another simple fuzzer that fuzzed memory mapped I/O (MMIO). Nothing fancy, just random bytes, words, and dwords to random memory addresses identified by the /proc/iomem file. Again the VM quickly crashed. More ASSERTs. At this point there were enough ASSERTs from the two fuzzers to wonder whether the dumb fuzzer approach was ever going to be viable. The fuzzers just kept hitting these very shallow ASSERT conditions and the program exited. It seemed that if I was going to keep fuzzing I’d need to do something smarter to reach vulnerable code without hitting the ASSERTs.
However, while wading through the ASSERTs, I realized that one of them was not like the others, rather it was a page fault in the hypervisor. The page fault handler printed debugging information then asserted! This could be interesting as it likely means some sort of memory corruption vulnerability was resulting in a read or write of unmapped memory, similar to a segmentation fault in a userspace program. I quickly triaged the rest of the crashes to see if anything else looked interesting and then re-ran the fuzzer on the MMIO addresses that crashed. It was consistently page faulting, but in different spots with different register contents. This was very encouraging! Tomorrow night I’d start reverse engineering and root causing this crash.
Night 4: Documentation, reverse engineering, and root cause
The crash occurred when fuzzing the virtio VGA device, specifically in the CommonCfg settings MMIO region:
| 01:00.0 VGA compatible controller [0300]: Red Hat, Inc. Virtio GPU [1af4:1050] (rev 01) (prog-if 00 [VGA controller]) Subsystem: Parallels, Inc. Virtio GPU [1ab8:0010] Control: I/O+ Mem+ BusMaster- SpecCycle- MemWINV- VGASnoopParErr- Stepping- SER R+ FastB2B- DisINTx+ Status: Cap+ 66MHz- UDF- FastB2B- ParErr- DEVSEL=fast >TAbort- <TAbort- <MAbort- >SERR- <PERR- INTxInterrupt: pin A routed to IRQ 31 Region 0: Memory at b0000000 (32-bit, prefetchable) [size=256M] Region 1: Memory at e2000000 (32-bit, non-prefetchable) [size=4K] Region 2: I/O ports at 6000 [size=32] Region 4: Memory at e2040000 (32-bit, non-prefetchable) [size=16K] Expansion ROM at 000c0000 [disabled] [size=128K] Capabilities: [40] MSI: Enable+ Count=1/1 Maskable+ 64bit+ Address: 00000000fee00000 Data: 402a Masking: 00000000 Pending: 00000000 Capabilities: [b0] MSI-X: Enable- Count=2 MaskedVector table: BAR=1 offset=00000000 PBA: BAR=1 offset=00000800 Capabilities: [bc] Vendor Specific Information: VirtIO: DeviceCfg BAR=4 offset=00003000 size=00001000 Capabilities: [cc] Vendor Specific Information: VirtIO: ISR BAR=4 offset=00002000 size=00001000 Capabilities: [dc] Vendor Specific Information: VirtIO: Notify BAR=4 offset=00001000 size=00001000 multiplier=00000000 Capabilities: [f0] Vendor Specific Information: VirtIO: CommonCfg BAR=4 offset=00000000 size=00001000 Kernel driver in use: prl_vid Kernel modules: prl_vid |
The crash seemed to be in the PciVirtIOWriteMM function based on the following backtrace in the log file:
| 01-31 19:47:56.774 F /MonitorBacktraces:2021:18adf/ mon.stack: <fffff00000195435> PciVirtIOWriteMM+0x205 01-31 19:47:56.774 F /MonitorBacktraces:2021:18adf/ mon.stack: <fffff000001074f9> EmulWrite+0x309 01-31 19:47:56.774 F /MonitorBacktraces:2021:18adf/ mon.stack: <fffff00000124246> DcSetArg+0xb6 01-31 19:47:56.774 F /MonitorBacktraces:2021:18adf/ mon.stack: <fffff0000012a3db> Em_MOV_func+0x3b 01-31 19:47:56.774 F /MonitorBacktraces:2021:18adf/ mon.stack: <fffff000001207f1> CpuExecuteEmulation+0x1d1 01-31 19:47:56.774 F /MonitorBacktraces:2021:18adf/ mon.stack: <fffff00000122232> DcExecuteInstruction+0x1852 01-31 19:47:56.774 F /MonitorBacktraces:2021:18adf/ mon.stack: <fffff00000041c18> VtxExecuteOp+0xb8 01-31 19:47:56.774 F /MonitorBacktraces:2021:18adf/ mon.stack: <fffff0000007a470> VtxLoopIteration+0x18c0 |
At this point, I grabbed the virtio specification and started reading.
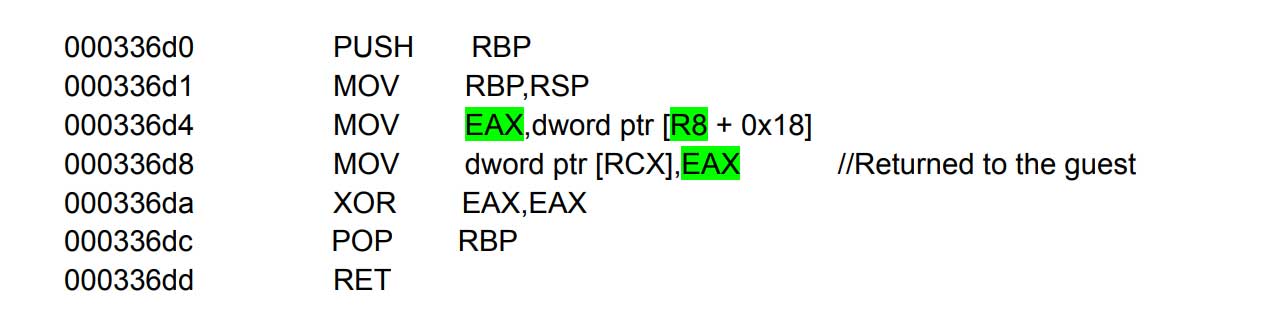
The vulnerability was soon obvious after skimming the virtio specification, bisecting the MMIO range that I fuzzed, and reverse engineering the PciVirtIOWriteMM function. The vulnerability is in the handling of virtio common configuration. The code stores guest supplied data (EBX) in the “Driver feature select” register (a global variable) without any bounds checking:

The value stored is then used as an index for writing a guest controlled value in the “Driver feature set” register:

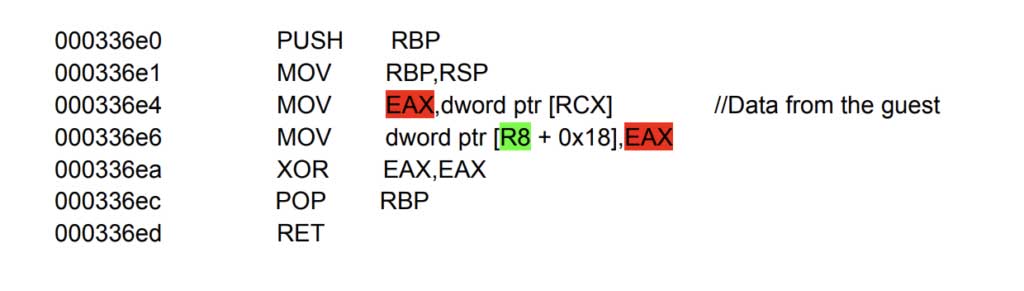
After tracking all the uses of the global variable that is guest controlled, a corresponding relative read primitive was found in the PciVirtIOReadMM function:

The value read into R8D is then returned to the guest.
This is a very strong exploitation primitive. A relative read and write in the data section should be winnable!
A vulnerability like this is normally not good enough to win Pwn2Own; it is shallow, and I found it using a very simple and direct fuzzing approach. In my experience, another competitor would likely find this vulnerability, or it would be patched before the contest. However, given my time constraints and life circumstances, I decided to roll the dice and see this through. At a minimum, I likely would learn more about Parallels Desktop during the exploitation process that would be useful in exploiting a different bug.
Night 5: My wife went into labor
Night 6: We had a baby boy!
Night 7: Did nothing
Night 8: Got shellcode running in the hypervisor
Next, I needed to use the relative read/write primitive to get control of the instruction pointer and then code execution in the hypervisor. I used the relative read/write primitive to install a port I/O handler at an unused address range. This seemed like a good way to get control of the instruction pointer given I could easily trigger the use of the handler from the guest.
When port I/O (either IN or OUTs) is performed, an array of struct io_port_handler entries in the __bss is indexed by the address to find the appropriate handler. The io_port_handler structure can be reverse engineered by looking at the AssignInPortFunc and the AssignOutPortFunc; it looks like this:
| struct io_port_handler { code *in_handler; void *data_for_in; code *out_handler; void *data_for_out; } |
The handler is then executed and the appropriate data pointer is passed as a parameter. I found an unused port I/O address range and wrote a pointer into the array that pointed to a fake struct io_port_handler installed in a data cave at the end of the __bss section. Issuing an IN on the appropriate address triggered execution of the handler I had installed in the data cave and gained control of the instruction pointer.
Once I had control of the instruction pointer, getting shellcode running in the hypervisor was easy as there are no memory protections against executing code from the __data or __bss section. I wrote the shellcode in the same data cave as the fake struct io_port_handler and then pointed the in_handler and out_handler` to the location of the shellcode. A subsequent IN or OUT on the appropriate address gets the shellcode executing.
Next steps: Shellcode running on the host
At this point I had shellcode running in the Parallels hypervisor. For Pwn2Own, I would need to pivot to the host and demonstrate that I had full control of the system. This process was straightforward but somewhat painful and laborious:
- Map a physical memory page into the hypervisor as readable and writable. After much reverse engineering, I found a set of functions in the hypervisor that did this for me.
- Scan for a target page in the host. Ideally, this would be a page with code in the prl_vm_app that was easily triggered from the guest.
- If the target page is found, overwrite it with shellcode that pops calc. Otherwise, go back to step 1.
Exploitation on Big Sur
Up to this point I’d been working on an old iMac. Unfortunately, Big Sur (required for Pwn2Own) was not supported on the older hardware. I borrowed a friend’s laptop and started testing the exploit. Predictably, it didn’t work. I soon learned that on Big Sur, Apple introduced a hypervisor API that changed how hypervisors could interact with the host kernel. Almost everything changed!
Parallels no longer controlled the hypervisor in the new API, so I needed to determine whether the vulnerable code was still present. For this, I needed to find it. It turns out that most of the virtual device code was abstracted into a host user mode library called libMonitor.dylib. After some nervous reverse engineering, I was certain the vulnerability was still present. However, I would need to change the exploit completely to account for all the exploit mitigations present in a user mode process. My plan was to first defeat ASLR, turn the relative read/write primitive into an absolute read/write primitive, and then figure out a way to get arbitrary code execution.
Address Space Layout Randomization (ASLR) defeat
Reading at offset six (24 bytes) from the relative read base address gives an address to another object in the __common section. This allows us to locate the base address of libMonitor.dyld and defeat ASLR.
Creating an arbitrary read/write primitive
I again manipulated the port I/O address handler array in the __bss to upgrade to an arbitrary read and write primitive. When port I/O is performed, the pointers in the io_port_handler structure are passed as parameters to the handler functions. By controlling these pointers (passed in R8) we can get an absolute read primitive using the existing `AhciIdpIndexInPortFunc`:
And an absolute write primitive using AhciIdpIndexOutPortFunc:
Execution primitive
At this point I have an ASLR defeat, absolute read and write primitive, and the ability to control the instruction pointer. For the purposes of demonstrating execution control for Pwn2Own, I chose to call system(“echo \”pwned!\” | open -f”). The address of system is found by reading __la_symbol_ptr::_gettimeofday (libMonitor.dylib + 0x109148). This gives an address in the dynamic linker cache. The system function is found at an offset from this. Finding a good way to turn the absolute write and execution control into the ability to call `system` with a controlled string took a significant amount of reverse engineering. I found a good gadget in the implementation of the SMBus virtual device to pivot from the memory write to calling a function of our choosing with a pointer to data we control as the first argument. The gadget is found in smb_write (libMonitor.dylib + 0x30c30):
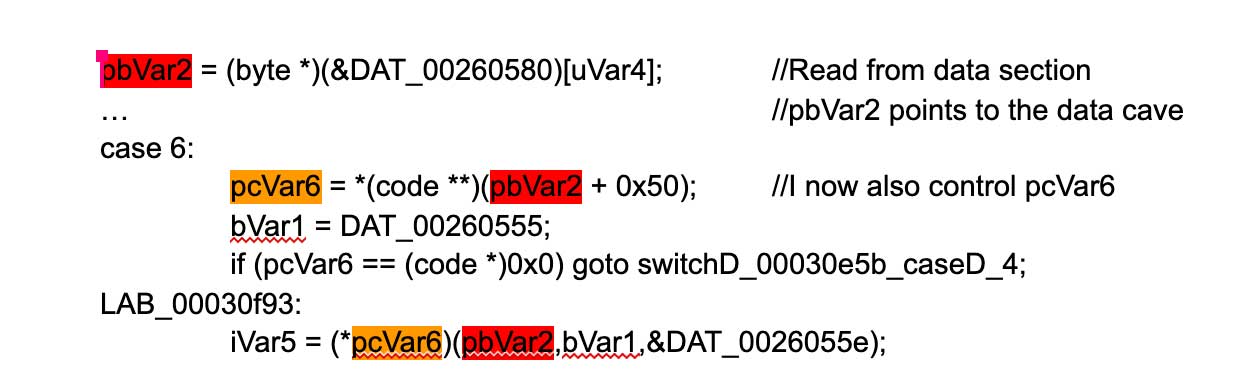
After pointing pcVar6 to system and writing a command string at pbVar2, all that is needed is to trigger execution of the smb_write function. Successful triggering should result in TextEdit displaying the string “pwned!”:
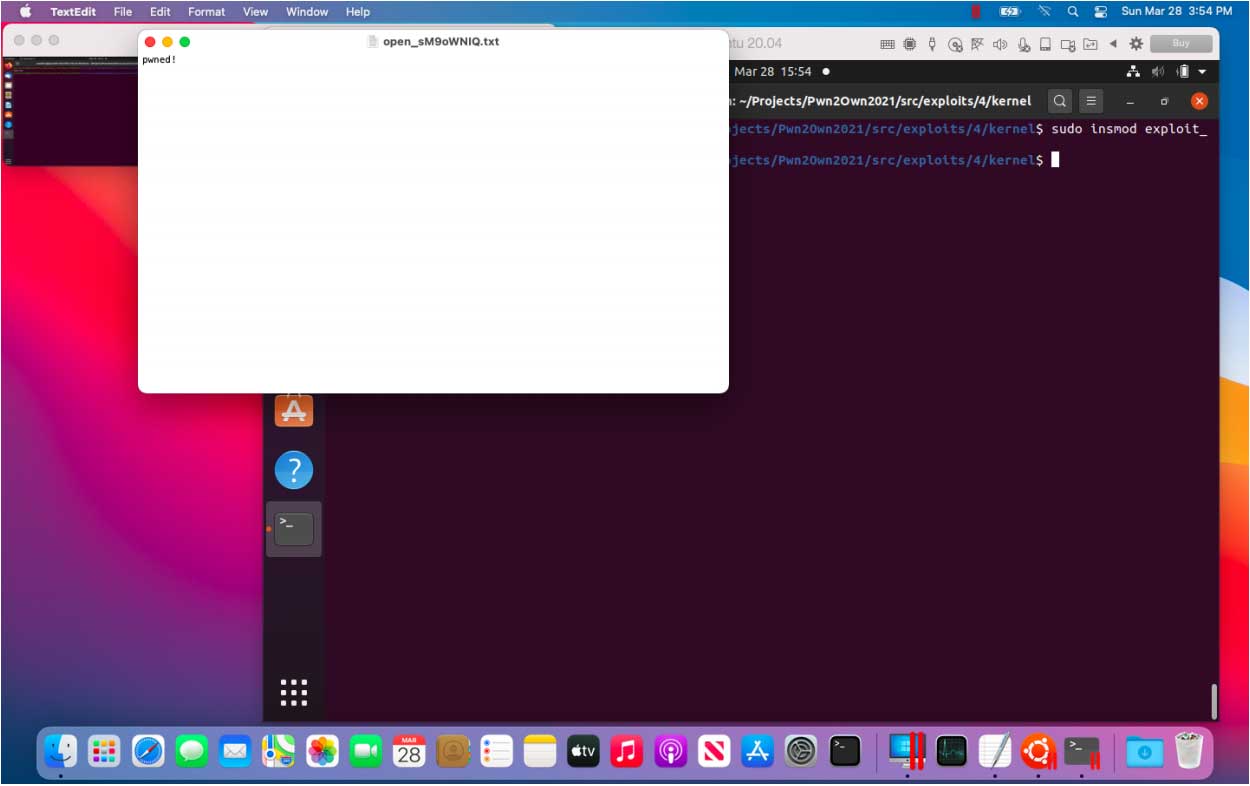
The exploit then cleans up and execution continues normally.
Conclusions
I spent the remaining weeks leading up to Pwn2Own nervously expecting the vulnerability to be patched. Thankfully, the vulnerability was unknown and did not collide with any other competitors. I was surprised by this result and think it was probably due to the large number of vulnerabilities in Parallels Desktop. Diving deep on any interface was likely a winning strategy for other competitors. I do not expect such shallow bugs to be present in the future.
I really enjoyed the entire process and was reminded of a few things:
- Just try. Not all Pwn2Own targets require novel vulnerability finding and exploitation techniques. Sometimes simple techniques work. Many evenings it is easier for me to read other people’s research, but I won’t find vulnerabilities reading blog posts. You find them by trying to do your own research.
- Reading previous work and specifications is helpful. Each individual must balance this with hunting for new bugs.
- When approaching a new target, I find it is easiest to start by doing simple, but useful, things. Sometimes this is as small as opening the software in Ghidra (or IDAPro), figuring out how the target logs data, or writing a simple fuzzer. The key is to get momentum and gain insight into the target. Save complex approaches for later when (or if) they are needed and you know more about the target.
- Make a plan for each chunk of focused time, no matter how small. For example, for the next thirty minutes I’m going to try to understand how the port I/O dispatching works. Not everyone can spend days looking at a target without distraction. Small chunks of purposeful time can make a difference.
- You don’t need to understand everything to make progress. Focus on what you know and methodically grow your knowledge and understanding of the target.
- A “good” vulnerability simplifies exploitation even when robust exploit mitigations are in place.
- After you have looked at a target, do a post-mortem reflection on what worked well and what did not to boost your learning. Did you miss vulnerabilities that other researchers found? Why did you miss them? What can you do differently next time to improve? This only works if you really try.