Sorry, you need to enable JavaScript to visit this website.
Skip to main content

Understanding Flood Models: A Guide

SA
Space & Airborne Systems
Oct 11, 2023 | 5+ MINUTE Read

Flood Models: What They Are, How to Make One and Why They’re Useful

Flood modeling is a powerful tool used to plan and prepare for various weather-related events. It allows users to predict and simulate where water might flow in a particular area.

Picture flood models as virtual ​“what-if” scenarios that help address problems a flood might cause before those problems occur in real life. 

Flood modeling uses predicted river flows, tidal shifts and rainfall, combined with topographic data like control points and elevation values, to generate flood risk information, such as depth, velocity and hazards — addressing the need for more accurate and accessible forecasting.

Floods come in various types, including fluvial floods, flash floods and storm surges. While flood models can encompass various formats based on your project's unique needs, the most sophisticated option is 2D imagery paired with 3D data — our specialty.

A 3D flood model is a dynamic visual rendering that considers multiple variables, along with collected and existing data points from various sources, to show the movement and behavior of floodwaters in a three-dimensional space — and how those floodwaters relate to the physical world around them. 

Geographic Information Systems (GIS)-based and remote sensor-based data models are superior to other flood models because they can integrate a broader range of information, combine different data types and support spatial visualization — providing actionable insights at critical junctures.

Why Your Project Needs Flood Modeling

It can save lives: Suppose you're building a dam upstream from a town. Exploring the various ways a broken dam might affect the surrounding environment is essential. An accurate terrain model can calculate water volumes and determine which areas will be inundated in a flood. If you know how much water is behind the reservoir, you can extrapolate how high the water level and flood surge will rise and how much of the town it will affect. This knowledge will help you store sandbags and supplies in suitable locations, protect critical utilities, plan safe evacuation routes and provide the public with actionable, up-to-date safety measures. In this case, accurate 3D modeling can save lives. 

It can also help repair infrastructure: Humans, by nature, are not proactive. Sometimes, we use dynamic flood models to solve critical issues after a storm has damaged the facilities we rely on.

Communities around the globe use data-based models and maps to help them protect and restore critical infrastructure in the wake of devastating storms. A country like Oman, for instance, situated on the southeastern coast of the Arabian Peninsula, is particularly vulnerable to tropical Cyclones. A recent Cyclone damaged a coastal road, significantly altering the terrain. Rebuilding the road requires new geospatial mapping – in this case, an accurate 3D model of the new terrain to help the engineers plan slopes and potential erosion risks before the proposed road is rebuilt, saving time and money. More recently, when a deadly Cyclone swept through Libya in September of 2023, satellite images of one of the devastated areas taken before (Figure 1 below) and after (Figure 2 below) show how the floods laid waste to buildings and critical infrastructure.

Flood Models 3 - pre

Figure 1: Derna, Libya. Captured by the Pleiades NEO sensor constellation at 30 cm resolution PLEIADES © CNES 2023, Distribution Airbus DS

Flood Models 3 - post

Figure 2: Derna, Libya. Captured by the Pleiades NEO sensor constellation at 30 cm resolution PLEIADES © CNES 2023, Distribution Airbus DS

Additional uses of flood modeling include: 

  • Mapping drainage for construction projects in mountainous areas 
  • Measuring property level risk
  • Providing alerts to public transportation 
  • Improving flood and emergency response
  • Planning for sea level rise
  • Assessing a flood's potential economic impacts 
  • Monitoring erosion 
  • Using different extrusion heights to represent various flood scenes
  • Managing dam and levee safety programs
  • Improving stormwater sewer design

Superior Geospatial Data — Delivered by Experts, Not Algorithms

Practical flood models require accurate positional information, the precise measurement of physical and topographic features, orthorectified imagery, and, most importantly, the guiding hand of a specialist well-versed in how water interacts with the physical world. 

While artificial intelligence (AI) and similar programs have particular benefits, primarily speed, they come up short compared to the rigorous processes geospatial experts employ. For instance, our team of photogrammetrists, programmers and imagery scientists manually create and edit elevation and geometric data to render custom 3D models, which have none of the pits, diffraction spikes, crooked linear features and other distortions and artifacts so often found in computer-generated data. These elements can provide users with inaccurate image pixels and negatively impact the interpretation of satellite data, affecting your decision-making and costing your team valuable time. 

When creating a flood model, the real work is managing the details — from identifying the unique relationships between data points to interpreting their significance and making subtle adjustments. In short, all the micro-insights an algorithm might struggle to compute. 

DTM or DSM?

Depending on your project's requirements and goals, we can help you present flood models as digital surface models (DSMs) or digital terrain models (DTMs), each being a continuous, three-dimensional geospatial data type. 

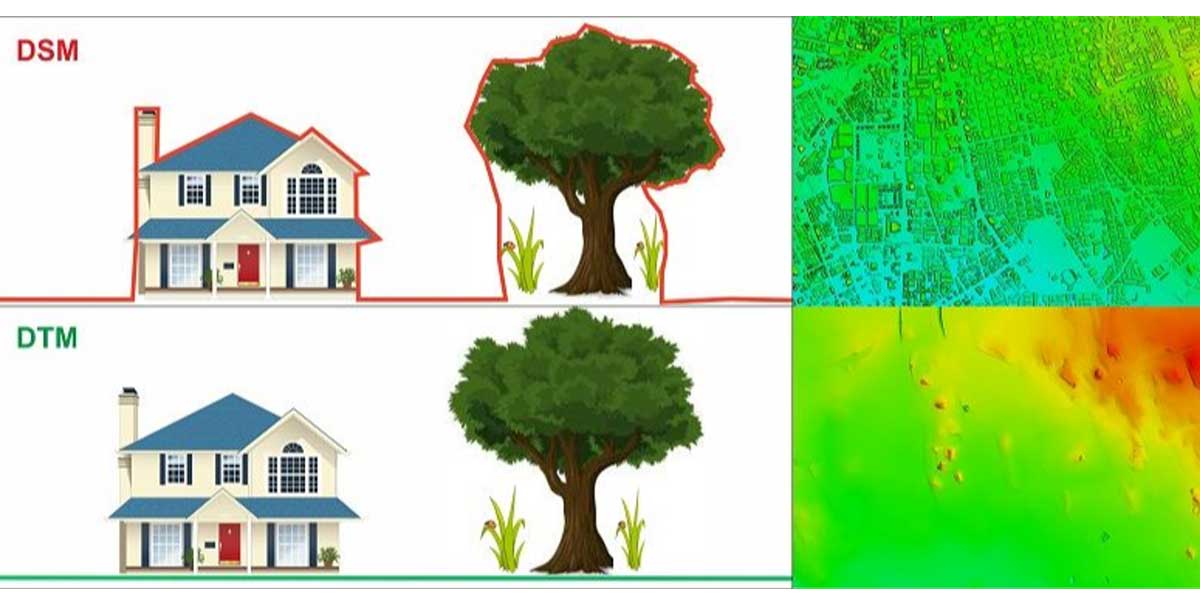
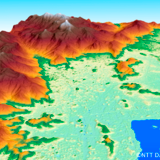
In Figure 3 (below) the DSM Graphic illustrates the approximate surface and height that would be delivered in a DSM data set shown by the red line. The features can be seen in the upper right as discernible structures. The DTM Graphic illustrates that human-made structures and vegetation areas are removed and that bare earth height would be delivered In a DTM data set shown by the green line. 

Digital Terrain Model (DTM)

Digital Terrain Model (DTM) data is a bare-earth model that contains elevations of only natural terrain features such as barren ridge tops and river valleys. Elevations of vegetation and cultural features, such as buildings and elevated roads, are digitally removed. DTM is hydro-enforced to ensure structures over water bodies (such as bridges and culverts) are removed, water surfaces are flat and watercourses flow downstream.

*DTM may be difficult in areas of very dense vegetation where a high percentage of the ground is not visible on the imagery. While areas that have a high percentage of ground that is obscured by aboveground features, such as buildings & trees, where the DTM will be interpolated from surrounding areas of visible ground, will not be as detailed. In cases where the ground is continuously obscured for large areas, it will not be possible to generate DTM data. 

Available DTM and DSM Resolution pixel sizes:

Worldwide

  • 0.5-meter
  • 1-meter
  • 2-meter
  • 2.5-meter
  • 4-meter
  • 5-meter
  • 12-meter
  • 20-meter
  • 24-meter
  • 30-meter

Additional resolution options for the U.S. and parts of Western Europe:

  • 0.4-meter
  • 0.8-meter
  • 1.6-meter


DSMs represent the Earth's surface, including natural and built/artificial features like buildings, vegetation and water bodies, along with the terrain's elevation and other structures. They can help assess flood risk in cities where urbanization significantly influences floods. 

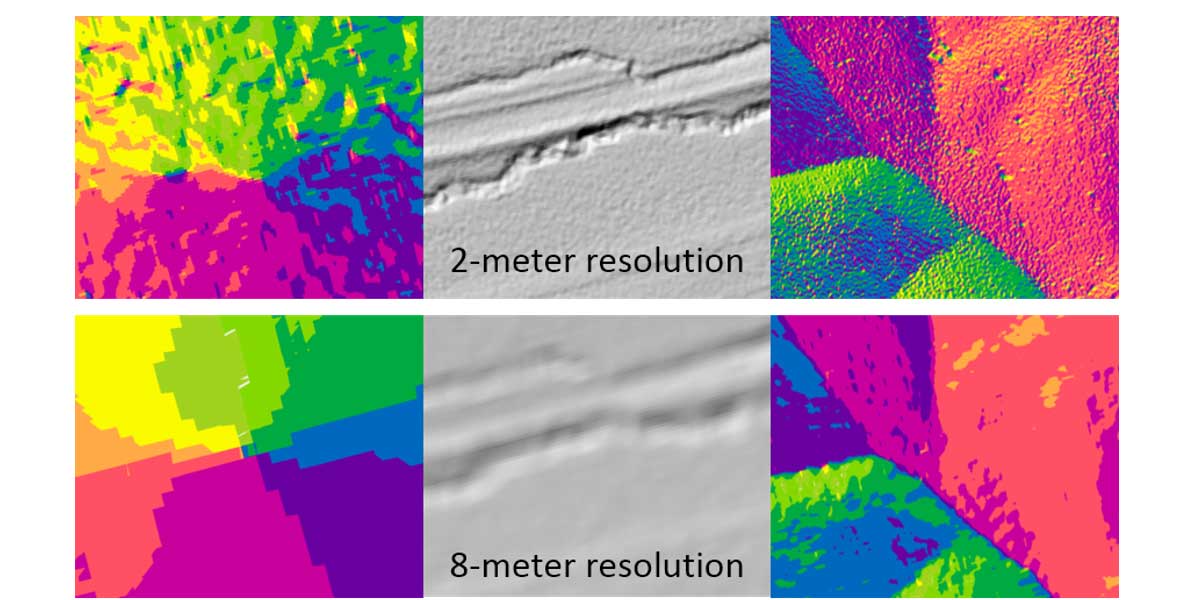
This graphic (Figure 4) shows the pixel density of three identical locations at both 2 m (above) and 8 m (below). The 2 m data pixels are much smaller and therefore relay much more detail of the terrain. The 8 m pixels are larger and therefore the model features are much more general. 

This graphic (Figure 4) shows the pixel density of three identical locations at both 2m (above) and 8m (below).

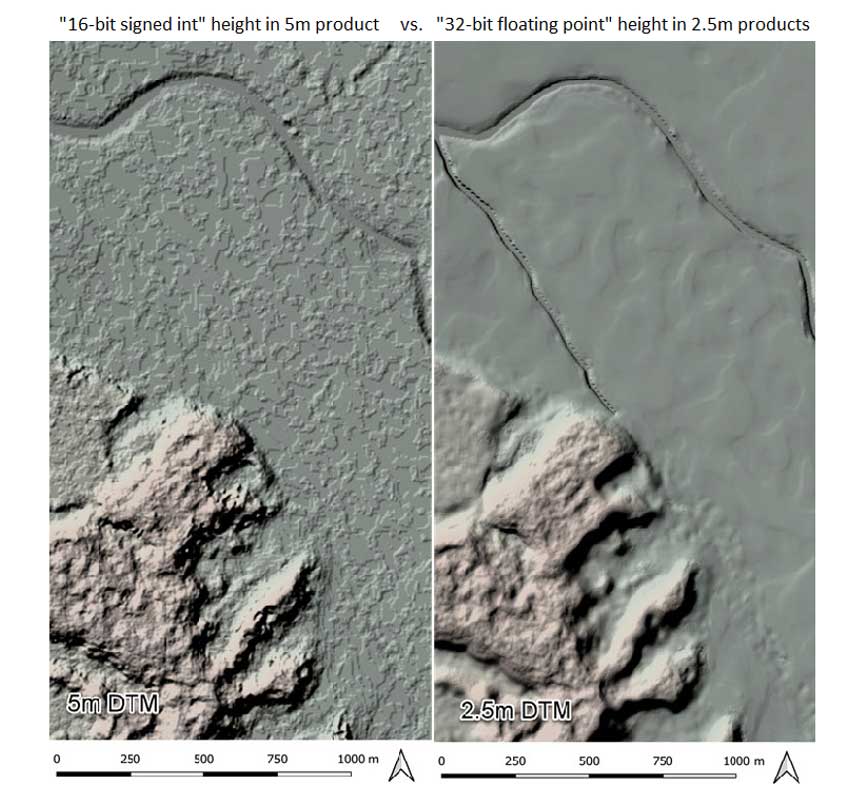
Below is an illustration (Figure 5) of the difference in the 2.5 m and 5 m resolution data products.  The 5 m data products have a more stair-stepped appearance. The more detailed and higher-resolution 2.5 m products deliver a smoother and more realistic model of the actual terrain features.

Below is an illustration (Figure 5) of the difference in the 2.5m and 5m resolution data products

DTMs represent the bare-earth elevation without considering any aboveground features, providing a clearer view of your point of interest's natural topography. They're vital for flood modeling in rural or open areas, where the terrain's natural features influence flood paths. They can also augment digital elevation models by reflecting vector features of rivers, ridges and other natural attributes. 

Most flood models are presented as DTMs, but you can also use a combination of DTMs and DSMs. Still, others might also include accurate 3D building data to produce models in highly developed areas. Integrating all available data sets can provide a more comprehensive and precise visual representation of the terrain's characteristics.

Resolution: The Broadest Range in the Industry

L3Harris offers the broadest range of commercially available low- to high-resolution satellite imagery. The data comes in various pixel resolutions ranging from 0.5 meters per pixel up to 12 meters per pixel and are created to your specifications. The more pixels you have, the more detail you'll get. The smaller the pixels, the more you can see. The size of your project site and areas of interest will ultimately determine your resolution needs. 

  • A resolution of 12 meters for a DTM is appropriate for regional coverage. That means each pixel covers 12 meters by 12 meters (approximately the size of a house).
     

If you need 3D elevation data for any type of flood modeling, please send your project area boundary to geospatialdata@l3harris.com for a free quote. 

Work with our experts to find and purchase the right geospatial data and imagery for your project.

Complete the form to get a quote from one of our representatives.

AREA OF INTEREST

CONTACT INFORMATION

Full Name *
Company Address
Industry

PROJECT INFORMATION

The costs and delivery schedules can vary widely for this service, depending on the difficulty of capturing new imagery and the complexity of the area terrain. To provide information on available options, we will need to understand more about your specific project. As applicable, please provide the following information so we can assist you further.